


- 2024-05-05 14:40 12194
- 产品价格:面议
- 发货地址:北京海淀 包装说明:不限
- 产品数量:9999.00 套产品规格:不限
- 信息编号:177668256公司编号:14832749
- 王经理 微信 18510103847
- 进入店铺 在线留言 QQ咨询 在线询价
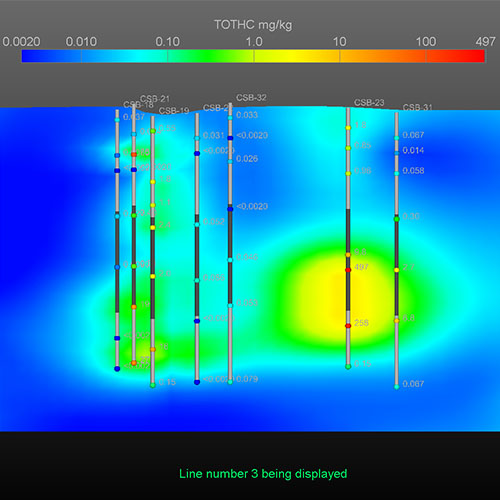
grapher程序 诚信代理
- 相关产品:
使用期限:*许可形式:单机原产地:美国介质:下载适用平台:windows
科学软件网专注提供科研软件。截止目前,共代理千余款,软件涵盖各个学科。除了软件,科学软件网还提供课程,包含34款软件,66门课程。热门软件有:spss,stata,gams,sas,minitab,matlab,mathematica,lingo,hydrus,gms,pscad,mplus,tableau,eviews,nvivo,gtap,sequncher,simca等等。Sections with multiple properties appear with a plus or minus to the
left of the name. To expand a section, click on the button. To collapse a
section, click on the icon. For example, the expanded End Styles section
contains three properties: Start, End, and Scale.
The Property Manager displays the properties for selected objects. To
change a property, click on the property's value and type a new value,
scroll to a new number using the buttons, select a new value using the
slider, or select a new value from the list or palette. For
example, a polyline has Style, Color, Opacity, and Width propertiesand an
End Styles sub-section with Start, End, and Scale properties. Changing the
Color requires clicking on the current color and selecting a new color from
the color palette. Changing the Opacity requires typing a new value or
clicking on the slider bar and dragging it left or right to a new value.
Changing the Width requires typing a new number or scrolling to a new

Plot Window
A plot window is the area used for creating and modifying graphs. When
you first open Grapher, you can choose to start from an empty plot
window. Multiple plot windows can be open at one time. Click the
document tabs to easily move between multiple plot windows.
Plot Document Pages
A plot document can have multiple pages. By default a plot document is
created with a single page. Add pages to the plot document by clicking the
+ button next to the page tabs. Pages are displayed as tabs at the bottom
of the plot window. Remove pages from the plot document by clicking the

Grapher .GRF Files
Grapher .GRF files contain all of the information necessary to reproduce
the graph, except for the data. When you save a Grapher file, all the
scaling, formatting, and parameters for the graph are preserved in the file.
Grapher .GRF files save a link to the data and do not store the data
internally in the file. For example, if a .GRF file needs to be sent to a
colleague, you would need to send the data file(s) used to create the graph
in addition to the .GRF file. This format is preferred for graphs where the
data changes periodically and needs to link to the external source data file.
When opening a GRF file, the data files are reloaded into Grapher. If the
data files haven't changed, the plots will look the exact same as when they
were saved. However, if the data files have been changed, the plots will
automatically update to reflect the changes in their source data. If the data
files can't be found, Grapher will prompt you for the data files to use for
your plots.

ASCII Data
ASCII files are generic format files that can be read or produced by most
applications. There are three common ASCII data formats: .DAT, .CSV,
and .TXT. These files can also be imported into most applications, including
word processors, spreadsheets, and ASCII editors. The files differ in the
types of delimiters, or column separators, between the data. ASCII files do
not contain any worksheet formatting information such as row height,
column width, or cell formatting. This format does not have a limitation on
the number of rows or columns.
Excel Files
Microsoft Excel .XLS, .XLSX, and .XLSM files contain data and retain some
cell formatting in Grapher. Some information, such as formulas, is
ignored. Excel files can preserve all formatting information available in the
Golden Software worksheet. An Excel 2003 .XLS worksheet has a 65,536-
row limit and a 256-column limit; therefore, this format cannot be used to
store very large data sets. An Excel 2007 .XLSX worksheet has a
1,048,576 row limit and a 16,384 column limit.
科学软件网不定期举办各类公益培训和讲座,让您有更多机会免费学习和熟悉软件。


