


- 2025-03-12 15:26 8294
- 产品价格:面议
- 发货地址:北京海淀 包装说明:不限
- 产品数量:9999.00 套产品规格:不限
- 信息编号:221967931公司编号:14832749
- 王经理 微信 18510103847
- 进入店铺 在线留言 QQ咨询 在线询价
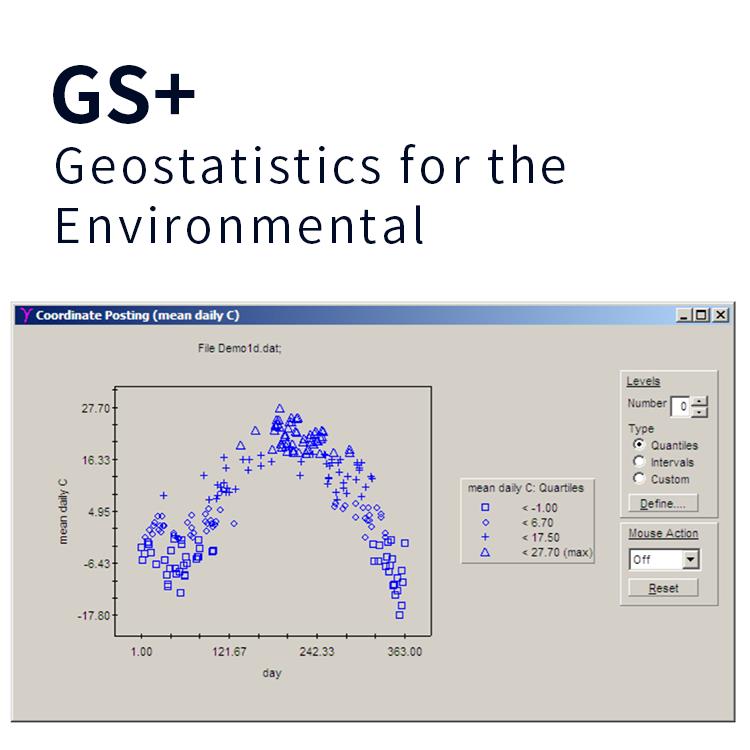
提供stata解决方案
- 相关产品:
科学软件网提供的软件覆盖各个学科,软件数量达1000余款,满足各高校和企事业单位的科研需求。此外,科学软件网还提供软件培训和研讨会服务,目前视频课程达68门,涵盖34款软件。
Bayesian and frequentist approaches have very different philosophies about what is considered fixed
and, therefore, have very different interpretations of the results. The Bayesian approach assumes that
the observed data sample is fixed and that model parameters are random. The posterior distribution
of parameters is estimated based on the observed data and the prior distribution of parameters and is
used for inference. The frequentist approach assumes that the observed data are a repeatable random
sample and that parameters are unknown but fixed and constant across the repeated samples. The
inference is based on the sampling distribution of the data or of the data characteristics (statistics). In
other words, Bayesian analysis answers questions based on the distribution of parameters conditional
on the observed sample, whereas frequentist analysis answers questions based on the distribution of
statistics obtained from repeated hypothetical samples, which would be generated by the same process
that produced the observed sample given that parameters are unknown but fixed. Frequentist analysis
consequently requires that the process that generated the observed data is repeatable. This assumption
may not always be feasible. For example, in meta-analysis, where the observed sample represents the
collected studies of interest, one may argue that the collection of studies is a one-time experiment.
summarize displays the mean and standard deviation of a variable across observations; program
writers can access the mean in r(mean) and the standard deviation in r(sd) (see [R] summarize).
egen’s rowmean() function creates the means of observations across variables. rowmedian() creates
the medians of observations across variables. rowpctile() returns the #th percentile of the variables
specified in varlist. rowsd() creates the standard deviations of observations across variables.
rownonmiss() creates a count of the number of nonmissing observations, the denominator of the
rowmean() calculation
Nonlinear DSGE models in Stata 15
In Stata 15, we introduced the dsge command for fitting linear DSGE models, which are time-series models used in economics and finance. These models are an alternative to traditional forecasting models. Both attempt to explain aggregate economic phenomena, but DSGE models do this on the basis of models derived from microeconomic theory.
New in Stata 16, the dsgenl command fits nonlinear DSGE models. Most DSGE models are nonlinear, and this means that you no longer need to linearize them by hand. When you enter equations into dsgenl, it linearizes them for you.
After estimating the parameters of your model with dsgenl, you can obtain the transition and policy matrices; determine the model’s steady state; estimate variables’ variances, covariances, and autocovariances implied by the system of equations; and create and graph impulse–response functions.
This is likely to be the favorite feature of macroeconomists and anyone working in a central bank.
主讲嘉宾
刘超,南开大学博士,曾赴爱尔兰格里菲斯学院交流学习,曾任河北金融学院教师,主讲计量经济学、统计学、与金融统计等课程。曾在《亚太经济》,《财经科学》,《农业技术经济》,《经济问题探索》等刊物发表多篇论文,并著有《中国金融发展的收入分配效应》。
科学软件网不定期举办各类公益培训和讲座,让您有更多机会免费学习和熟悉软件。


