


- 2025-03-11 15:26 16894
- 产品价格:面议
- 发货地址:北京海淀 包装说明:不限
- 产品数量:9999.00 套产品规格:不限
- 信息编号:223280943公司编号:14832749
- 王经理 微信 18510103847
- 进入店铺 在线留言 QQ咨询 在线询价
本地化服务_stata软件
- 相关产品:
stata软件
科学软件网销售软件达19年,有丰富的销售经验以及客户资源,提供的产品涵盖各个学科,包括经管,仿真,地球地理,生物化学,工程科学,排版及网络管理等。此外,我们还提供很多附加服务,如:现场培训、课程、解决方案、咨询服务等。
统计功能介绍
Stata使得大量的统计工具用于指尖
● 基本表格和总结
● 案例对照分析
● ARIMA
● ANOVA 和MANOVA
● 线性回归
● 时间序列平滑
● 多层模型
● 生存分析
● 动态面板数据回归
● 结构方程建模
● 二进制,计数和审查结果
● ARCH
■ 标准方法,如■ 方法,如
● 多重替代法
● 调查数据
● Treatment effects
● 统计
● 贝叶斯分析
● ……
Nonparametric series regression
Stata 16's new npregress series command fits nonparametric series regressions that approximate the mean of the dependent variable using polynomials, B-splines, or splines of the covariates. This means that you do not need to specify any predetermined functional form. You specify only which covariates you wish to include in your model. For instance, type
. npregress series wineoutput rainfall temperature i.irrigation
Instead of reporting coefficients, npregress series reports effects, meaning average marginal effects for continuous variables and contrasts for categorical variables. The results might be that the average marginal effect of rainfall is 1 and the contrast for irrigation is 2. This contrast can be interpreted as the average treatment effect of irrigation.
Being a nonparametric regression, the unknown mean is approximated by a series function of the covariates. And yet we can still obtain the inferences that we could from a parametric model. We use margins. We could type
. margins irrigation, at(temperature=(40(5)90))
and obtain a table of the expected effect of having irrigation at temperatures of 40, 50, ..., 90 degrees. And we could graph the result using marginsplot.
Even more, npregress series can fit partially parametric (semiparametric) models.
Multiple-group IRT models in Stata
IRT models explore the relationship between a latent (unobserved) trait and items that measure aspects of the trait. This often arises in standardized testing where the trait of interest is ability, such as mathematical ability. A set of items (test questions) is designed, and the responses measure this unobserved trait. Researchers in education, psychology, and health frequently fit IRT models.
Stata’s irt commands fit 1-, 2-, and 3-parameter logistic models. They also fit graded response, nominal response, partial credit, and rating scale models, and any combination of them. And after fitting a model, irtgraph graphs item-characteristic curves, test characteristic curves, item information functions, and test information functions.
New in Stata 16, the irt commands allow comparisons across groups. Take any of the existing irt commands, add a group(varname) option, and fit the corresponding multiple-group model. For instance, type
. irt 2pl item1-item10, group(female)
and fit a two-group 2PL model.
Group-specific means and variances of the latent trait will be estimated. Group-specific difficulty and discrimination parameters can also be estimated for one or more items. With constraints, you can specify exactly which parameters are allowed to vary and which parameters are constrained to be equal across groups.
You can even use likelihood-ratio tests to compare models with and without constraints to perform an IRT model-based test of differential item functioning.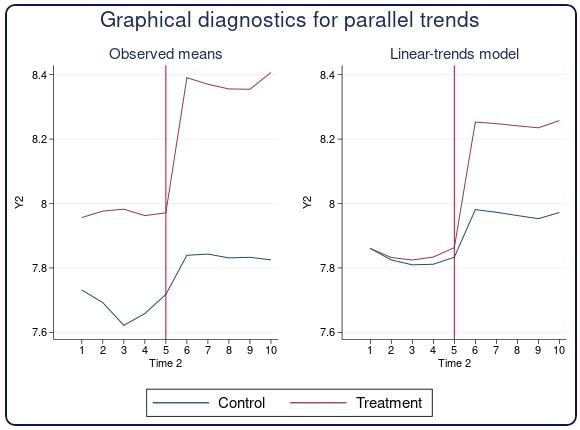
Nonlinear DSGE models in Stata 15
In Stata 15, we introduced the dsge command for fitting linear DSGE models, which are time-series models used in economics and finance. These models are an alternative to traditional forecasting models. Both attempt to explain aggregate economic phenomena, but DSGE models do this on the basis of models derived from microeconomic theory.
New in Stata 16, the dsgenl command fits nonlinear DSGE models. Most DSGE models are nonlinear, and this means that you no longer need to linearize them by hand. When you enter equations into dsgenl, it linearizes them for you.
After estimating the parameters of your model with dsgenl, you can obtain the transition and policy matrices; determine the model’s steady state; estimate variables’ variances, covariances, and autocovariances implied by the system of equations; and create and graph impulse–response functions.
This is likely to be the favorite feature of macroeconomists and anyone working in a central bank.
科学软件网不定期举办各类公益培训和讲座,让您有更多机会免费学习和熟悉软件。


