

- 2025-02-21 15:26 3594
- 产品价格:面议
- 发货地址:北京海淀 包装说明:不限
- 产品数量:9999.00 套产品规格:不限
- 信息编号:254379371公司编号:14832749
- 王经理 微信 18510103847
- 进入店铺 在线留言 QQ咨询 在线询价
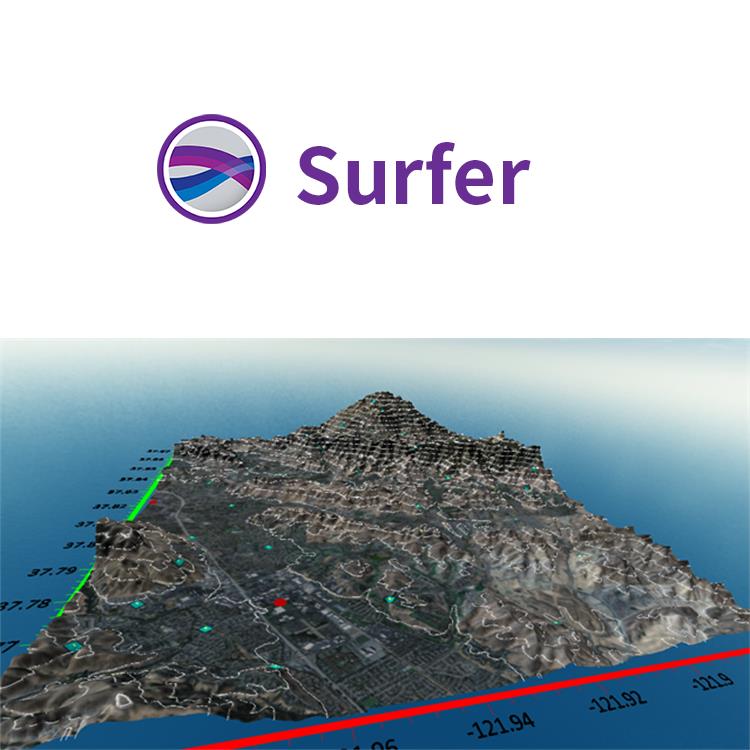
购买surfer软件以及培训班 正规代理
- 相关产品:
科学软件网提供的软件覆盖各个学科,软件数量达1000余款,满足各高校和企事业单位的科研需求。此外,科学软件网还提供软件培训和研讨会服务,目前视频课程达68门,涵盖34款软件。
Grid Data with Certainty
Have complete confidence in the accuracy of your model. Surfer provides numerous interpolation methods to grid regularly or irregularly spaced data onto a grid or raster, and each interpolation method provides complete control over gridding parameters. Plus, no time is wasted with multithreaded gridding!
Local Polynomial
Polynomial Regression
Data Metrics
Radial Basis Function
Modified Shepard's Method
Moving Average
可视化数据
使用Surfer广泛的建模工具以正确的方式显示数据,同时保持准确性和性。用Surfer可以明确的传达您的信息。
分析数据
用Surfer众多的分析工具深度分析您的数据。调整插值和网格参数,评估数据与函数空间的连续性,定义故障和断线,或执行网格计算,如卷、变换、平滑或滤波。Surfer快速将数据转化为知识。
结果说明
自信的传达您来之不易的发现。无论是项目经理、论题顾问还是客户,Surfer有助于全面透彻地理解数据。
信任自1983年
Surfer经受住了时间的考验。成千上万的科学家和信任Surfer来展示他们的数据。
Surfer适用的行业包括
农业
考古
建筑
教育
能源
环境
勘探
地球物理
程
地热
地理信息系统
海事
军事
采矿
泥浆录井
石油与天然气
可再生能源
无人机
公共事业
水利
Surfer适用的行业包括
农业
考古
建筑
教育
能源
环境
勘探
地球物理
程
地热
地理信息系统
海事
军事
采矿
泥浆录井
石油与天然气
可再生能源
无人机
公共事业
水利
创建的地图
轻松沟通简单和复杂的空间数据。Surfer提供创建高质量地图工具,可以清楚的向同事、客户和利益相关者传统信息。
Use Data in Date/Time Format
Visualize your data with respect to time! Surfer 12 supports dates and times as v alid data. This means you can use dates and times as a data variable for gridding, for creating post maps, and you can format data in the workshe et or text labels in multiple date and time formats.
< span>
Grid and Display Maps with Logarithmic Z Scale
Effectively display Z data that range over s everal orders of magnitude! You can grid data taking the log of the Z value prior to gridding, choose to have logarithmically scaled contour levels, or h logarithmic scaling applied to the color scale. This is extremely useful when your data file has extreme data ranges, such as concentration data where t he Z values can span multiple orders of magnitude (i.e. >1 to<20000).
科学软件网专注提供正版软件,跟上百家软件开发商有紧密合作,价格优惠,的和培训服务。


