


- 2025-02-20 15:26 11494
- 产品价格:面议
- 发货地址:北京海淀 包装说明:不限
- 产品数量:9999.00 套产品规格:不限
- 信息编号:254711368公司编号:14832749
- 王经理 微信 18510103847
- 进入店铺 在线留言 QQ咨询 在线询价
销售grapher软件 诚信代理
- 相关产品:
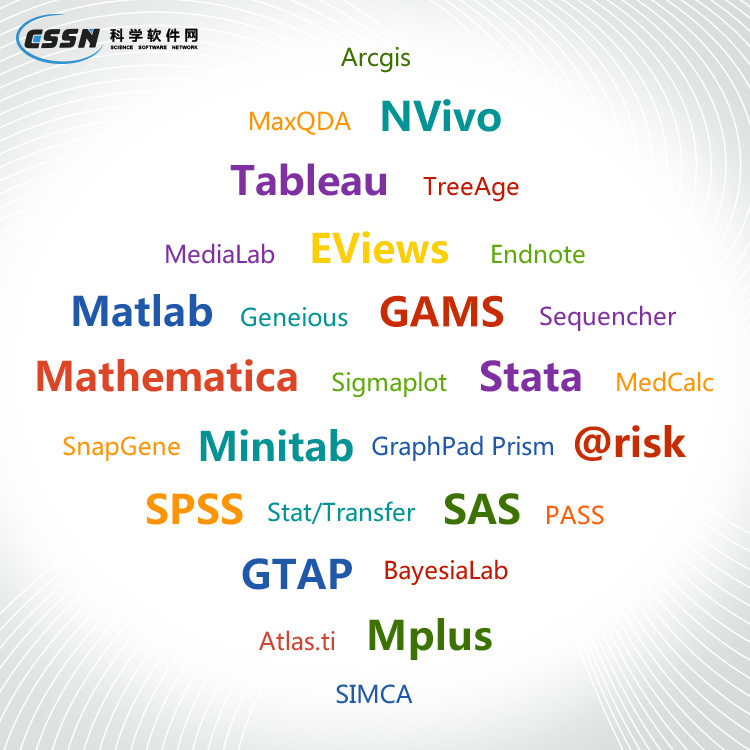
科学软件网销售软件达19年,有丰富的销售经验以及客户资源,提供的产品涵盖各个学科,包括经管,仿真,地球地理,生物化学,工程科学,排版及网络管理等。此外,我们还提供很多附加服务,如:现场培训、课程、解决方案、咨询服务等。
Represent Data at Its Best
Control every aspect of your plot down to the smallest detail. Grapher’s extensive customization options allow you to convey complex ideas in an easy-to-understand manner. Grapher displays your data at its very best.
The graph is created with the specified properties. You can change the
properties of a selected graph, plot, or axis through the Property Manager.
Creating Graphs in the Plot Window
The most common method of creating graphs is to use the Home | New
Graph commands. To create a graph in the plot window:
1. Click or scroll to the Home tab.
2. In the New Graph group, click the Basic, Bar, Polar, Ternary,
Specialty, Statistical, or Contour Surface plot category.
3. Click on the plot type you would like to create.
4. Select a data file in the Open Worksheet dialog and click Open. If you
are creating a contour grid map or surface grid map, you are prompted
for a .GRD file. If you are creating
Grapher 2D/3D绘图和统计分析软件
Each item in the Object Manager list consists of an icon indicating the
object type, a text label for the object, and a visibility check box. A check
mark indicates that the object is visible. An empty box indicates that
the object is not visible. Click the check box to change the visibility of the
item. Invisible objects do not appear in the plot window or on printed
output.
To change the visibility for multiple selected objects, right-click in the
Object Manager and click Toggle Visibility. Visible selected objects will
be hidden, and hidden selected objects will become visible.
科学软件网主要提供以下科学软件服务:
1、软件培训服务:与国内大学合作,聘请业内人士定期组织软件培训,截止目前,已成功举办软件培训四十多期,累计学员2000余人,不仅让学员掌握了软件使用技巧,加深了软件在本职工作中的应用深度,而且也为同行业人士搭建起了沟通的桥梁;
2、软件服务:提供软件试用版、演示版、教程、手册和参考资料的服务;
3、解决方案咨询服务:科学软件网可向用户有偿提供经济统计、系统优化、决策分析、生物制药等方面的解决方案咨询服务;
4、软件升级及技术支持服务:科学软件网可向用户提供软件的本地化技术支持服务,包括软件更新升级、软件故障排除、安装调试、培训等;
5、行业研讨服务:科学软件网会针对不同行业,邀请国内外以及软件厂商技术人员,不定期在国内举办大型研讨会,时刻关注前沿技术,为国内行业技术发展提供导向。


